Helping young people beat the odds is not enough: It’s time to change the odds. That’s the message of a new report released by #DegreesNYC, a collective impact movement to open doors to education co-founded by Goddard Riverside.
The Changing the Odds report springs from a single question Degrees posed in 2016, the year it was founded: “Why aren’t more low-income students and students of color accessing and completing postsecondary education?” After reaching out to colleagues and community members, “We received thousands of suggestions for indicators to measure whether young people were on a path for success,” the authors write. “Hundreds of people worked on task forces, work groups, and youth councils, discussing, suggesting, and proposing indicators.”
Then, with the help of the Research Alliance for New York City Schools, they began crunching the numbers. The results were striking.
The team looked at two markers of success in high school. Being “on track” in the 9th grade meant the student completed 10 credits and passed one statewide test. In the 12th grade, the team measured how many were still in school and had a cumulative GPA of 80 or above. They then tracked 65,652 students on a ten-year path through enrolling in college, staying in college, and completing college … and put all 65,652 paths into one chart.
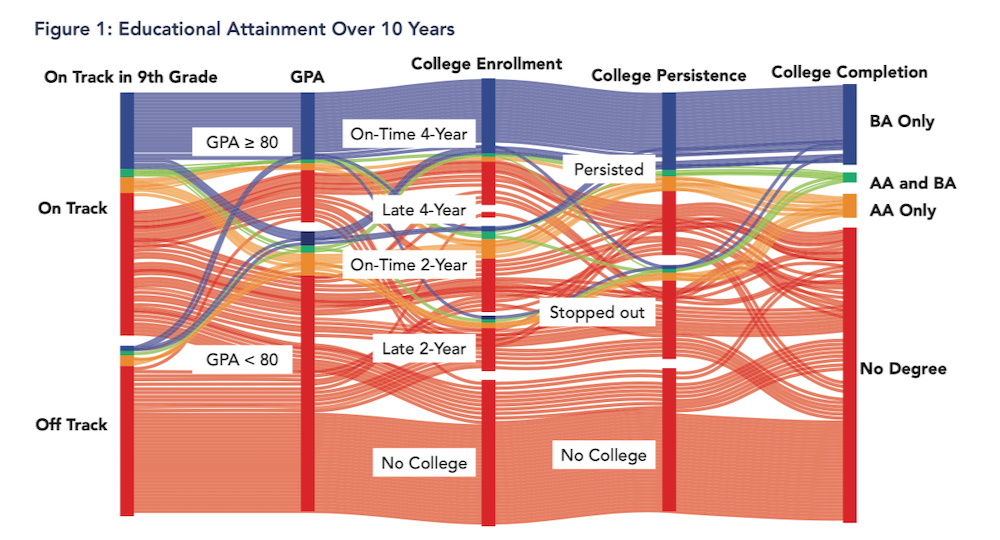
The findings included:
· 41% of on track students earn a degree; 10% of off track students earn a degree.
· 59% of students with an 80+ cumulative GPA earn a degree; 14% of students with less than an 80 cumulative GPA earn a degree.
· Whether or not they start on time, 61% of students who start at a four-year college earn a degree; 27% of students who start at a two-year college earn a degree.
· 60% of students who did not take a break in attending college earn a degree; 16% of students who stop out earn a degree.
In the launch event for the report, Lisa Merrill of Research Alliance for New York City Schools explained why the graph is so troubling.
“Where you start off in 9th grade is immediately important to where you wind up 10 years later,” she said. “There’s not a lot of room for getting off that path and there’s not a lot of space for getting back on that path in our system currently, and that’s something that needs to change.”
The team then went on to look at the students’ backgrounds. At every step of the way, they found large, persistent differences in achievement based on students’ race/ethnicity. For example, just over half of Black and Latinx students are on track at the end of 9th grade compared with over 80% of White and Asian students. Merrill said it was important to understand these numbers as indicators of a systemic problem.
“When we see differences between students, it’s not deficiency of an individual student,” she said, but “systematic racism across students’ experiences.”
DegreesNYC Youth Council Co-Coordinator Carolina Cortez-Rivera underlined that point. “We must be explicit in addressing these issues as stemming from racial inequality,” she said. “It should alarm us that black and brown students continue to be failed by an education system that does not adequately support their pathways to success.”
The report offers numerous recommendations to help create “accessible, inclusive, and just education systems co-led with young people and informed by data.” These touch on everything from ample food and housing to quiet study spaces, equitable testing and opportunities to lead. It also offers five rousing calls to action:
· Explicitly explore and address the persistent systemic racial inequities.
· Strengthen multiple pathways to college and successful careers.
· Make space for youth voice and leadership at every decision-making table at every level.
· Demand and use systemwide data to “see the inequities.”
· Move together.
The report’s release date—Martin Luther King Jr. Day—was no accident, said #DegreesNYC Deputy Director LaKisha N. Williams. She noted that King worked closely with a network of collaborators to build his movement.
“The data is clear, the student experiences bear witness. It’s time to move— and move together,” she exhorted.
“Too much is at stake and our children and their children will bear the brunt if we don’t get it right.”